Examining the Limits of Building Energy Efficiency Through Side-by-Side
Testing
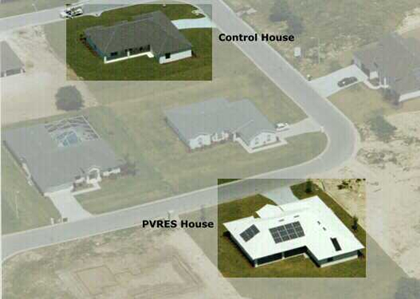
In 1998, FSEC began its Zero Energy Homes research program in collaboration with the City of Lakeland municipal utility and builder Rick Strawbridge. Two homes, one the builder’s standard model (the Control) and the other a super-energy-efficient photovoltaic residence (PVRES), were constructed and tested on a side-by-side basis for more than a year. The goal was to determine the extent to which contemporary energy efficiency technologies can reduce the demand for electricity in Florida homes. The measured results from this project were very encouraging and have since formed the basis for a national Zero Energy Homes program.
More information about the Zero Energy Home in Lakeland, Florida:
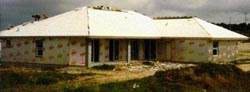
Below is an aerial photograph showing the two homes used in the Lakeland Zero Energy Homes project. As the photo indicates, the homes are identical in floor plan and orientations. However, they differ greatly in energy-efficiency with the Control Home being the builder’s “standard” model that meets Florida’s relativly stringent energy code and the PVRES home including the most energy-efficient provisions the FSEC project team could devise.
Annual Energy Use
In one year, the PVRES home used 6960 kWh of electricity and had a PV system production of 5180 kWh. For the same year, the Control used 22,600 kWh. A yearly energy savings is due to the differences in the energy efficiency of the two homes of 70%. Putting the PV system production into the numbers
shows that the PVRES house’s net energy use (electricity from the utility) for the entire year was only 1780 kWh. Note in Figure 1 below that comparing the PVRES house energy, including the energy it produced, against the standard house shows that the PVRES house had a 92% utility energy savings compared
to the standard house.
Peak Electric Demand
Peak electric demand is perhaps even more important than annual energy use. With the help of the PV system, the PVRES home placed nearly zero net demand on the utility system during periods of peak electric demand!
This fact is clearly shown below in Figure 2, which plots the July 18, 1998, peak day energy demand, PV power production and net utility power data for the PVRES home. Note the green line, which shows the net utility energy used by the PVRES house on the hottest day in recorded history for Lakeland!
A similar energy use and production plot for the annual average day shows even more impressive results for the PVRES home with net power flowing from the home to the utility for almost the entire period of daylight. Figure 3 below illustrates this fact, showing the annual average PV output and the utility peak load reduction (shaded). Again, note the green line showing power going from the home to the utility during daylight hours.
annual average PV production, total home energy use and net home energy use for PVRES home during 1998-1999 monitoring period.
Building Envelope
House and Duct Airtightness

Air infiltration can represent a major cooling load in Florida’s hot and humid climate. We used a Minneapolis blower door (Figure 23) to measure house tightness in both homes on April 22, 1998. For the Control home the total overall building tightness of the control house was 2,025 CFM50 or 6.3 ACH50 with a house equivalent leak area (ELA) of 95.2 square inches. The overall tightness of the PVRES home was 1587 CFM50 or 4.9 ACH50 with a house ELA of 69.0 square inches. For Central Florida’s climate, a useful rule of thumb to determine the house natural air infiltration rate is to divide the house ACH at 50 pascals by 30. This would estimate a typical natural air change rate of about 0.16 ACH in the PVRES home and 0.21 ACH in the Control. In both homes, we noted that much of the leakage to the outside appears to be from the 30 recessed lighting cans in the ceiling.
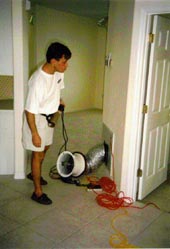
We used a Duct Blaster™ (Figure 24) testing device to determine the relative leakage in the return and supply sides of the duct systems in both homes. In the Control home, the total CFM25 leakage of the duct system to outside the conditioned space was 122 CFM25. Given its 2,425 square feet of conditioned area, the duct leakage to outside is 0.05 cfm/ft2. This compares to the 0.03 cfm/ft2 proposed as a standard for utility new homes programs. In the PVRES home, the total CFM25 leakage of the duct system from outside the conditioned space was 50 CFM25 or about 0.021 cfm/ft2 – a low value.
In summary, we found that the tightness of the duct system of the Control home was very average relative to most homes which we have tested. One limitation of the test, however, is that with the air handler operating, all the leaks are not the same. Ceiling penetrations close by the air handler can bring air from the attic — air that is super heated in the Control home. Moreover, any of the 50 cfm air that is unintentionally drawn from the attic is being taken from a space that typically gets no hotter than the outside ambient air temperature. The PVRES home, with its interior duct system, on the other hand, had as low a leakage to the outside of the building of any that have been tested by FSEC.
Evidence of unintended air leakage in the Control home from the attic to the air handler casework in its interior closet was clearly seen in infrared thermography on the air handler (Figure 25). This is contrasted by the lack of such leakage with the interior duct system in the air handler case itself suggests that ceiling penetrations by the air handler closest will lead to air being drawn from the space. It also suggests the great hazard of allowing air handlers to be located within attic spaces.
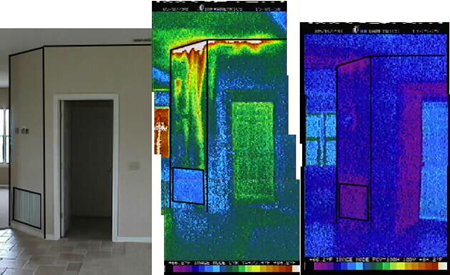
Our test results indicate a fairly tight building envelope for both homes, with the PVRES home somewhat better. However, the leakage duct systems for the two homes show large differences, mainly due to interior duct system in the PVRES site. Moreover, thermography showed that the leakage from the attic to the air handler at the Control site has disproportionate impact on cooling efficiency.
Measured Building Air Infiltration Rates
To supplement the blower door test, we evaluated the in situ air infiltration rate in both homes using sulfur hexafluoride (SF6) tracer gas decay. The blower door indicated that the PVRES home was tighter with less leakage area, but how the tightness will impact actual air leakage rates is strongly influenced by the operating pressures within the building, particularly when the mechanical air distribution system is operating.
Both homes were evaluated on May 20, 1998 with the air handler on and off. The tracer gas concentration decay was measured by two Bruel & Kjaer Model 1302 multi-gas monitors over a one hour period subsequent to SF6 injection. The air handler off test provides information on the “natural air infiltration rate” from air leakage driven by temperature differences and wind on the external building envelope. The air handler on test shows how operation of the mechanical air handler equipment can impact the overall building leakage rate in air changes per hour. Past studies have shown that operation of the air handler will typically increase building air leakage rates by two to three time the “natural” rate which is typically low in Florida homes due to the small driving forces (buoyancy and wind) [10]. However, we would expect the interior duct system in the PVRES home to somewhat reduce the relative impact.
Table 4:
Measured House Air Infiltration Rates
SF6 Tracer Gas Decay Test
Description |
Status |
Per Hour |
(oF) |
(oF) |
(m/s) |
| Control | |||||
| Control | |||||
| PVRES | |||||
| PVRES |
The PVRES home evidenced tighter construction in all cases the air change rates were low. The natural infiltration rates (air handler off) were 0.085 and 0.131 ACH in the PVRES and Control homes respectively. The air change rates with the air handler operating was 0.131 in the PVRES and 0.349 in the Control revealing that the air handler operation increased building air leakage by 54% and 266% respectively.
It is important to note that in all the cases the building ventilation rate was low relative to the recommended rates within ASHRAE standard 62-1989 of 0.35 ACH [17]. However, it cannot be argued that the higher infiltration rates for the Control home are better, since much of the infiltration air is coming from an undesirable location (the hot attic). The data do suggest, however, that some system of mechanical ventilation with heat and enthalpy recovery may be desirable for future homes of this type.
Construction
PVRES Efficiency Features

3 feet PVRES overhang on right.
The specific efficiency features in the PVRES house are detailed below:
Wider Overhang
In Florida “Cracker” homes, built at the turn of the century before air conditioning, wide porches and deep overhangs were considered essential to achieve comfort. However, with the advent of air conditioning, many new homes have sacrificed overhangs in interest of first cost. New residences in modern developments often have practically no overhangs.
For solar control on walls and windows, the PV home has a 3 foot overhang around the perimeter of the building while the standard home has one and a half foot overhang. Figure 1 shows the shade line difference produced by such an overhang. In the photos taken during construction, project engineer John Sherwin measures the length of the overhang shadow along the south wall of the two homes at 11:10 AM on October 1st, 1997. The standard home, shown on the left, with a 1.5 foot overhang casts a shadow length of just 36 inches – barely enough to reach the tops of the window. At the same time, the shadow cast on the PV home is nearly 72 inches long. The overhang shades most of the wall and at least 75% of the south and east window area. Figure 5 shows the impact of the overhang as seen from an interior thermograph of a west window. The cooler upper shade line is clearly visible.
Exterior Wall Insulation
In conventional residential construction in Florida, walls are insulated with R-3 to R-5 ft2 · h · oF/Btu insulation on the interior of the masonry walls. Although, this may seem low relative to building practices in northern climates, previous field monitoring has shown that a insulation can only reduce space cooling by 5-10% in Florida’s climate [8]. The most common wall insulation system in Florida to meet the insulation requirement is a layer of foil (Fi-foil Reflective Insulation) suspended between interior furring strips with an equivalent insulation value of R-4.2. Figure 6 shows the interior east wall of the control home in the early afternoon. The effectiveness of the Fi-foil is seen with the fact that the furring strips are warmer than the low emissive surface in between.
However, the concrete block walls of the PVRES home were better insulated on the exterior both in order to assist with reducing the cooling system size and to help with the load shift objective within the project. The Celotex Corporation supported the project by providing 1¼” Tuff-R C isocyanurate insulation and worked with the builder to resolve issues associated with the unusual application (Figure 7).
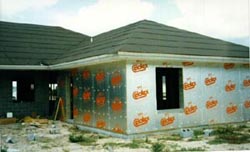
An exterior application was used to encapsulate the building in R-10 insulation so that the masonry portion of the building could be pre-cooled during the daytime hours when solar availability is high and the PV system output is at its maximum. The intent was to utilize the thermal capacitance of the building and its masonry to help to reduce air conditioning needs during the late afternoon and early evening hours.
Advanced Solar Control Windows
Windows are known to be the large source of cooling loads in Florida residential buildings.(13) Generally, a low Solar Heat Gain Coefficient (SHGC) is needed to keep out the sun’s heat, and a low conductance or U-value (Btu/hr-sqft-oF) is important to reduce the design cooling load. The most common windows used in Florida homes do not well meet these needs. Typically, windows are single pane clear glass with aluminum frames (SHGC = 0.875, U = 1.1).
For the PVRES home, we attempted to locate a superior product. However, simply a low SHGC could not be the sole objective; very low solar heat gain values can indicate windows with a dark tint that transmit very little visible light. This can reduce daylight to an extent that occupants have to use electric lighting to supplement interior light levels. Physical appearance was also considered important; this generally excludes either dark tints or reflective products which give the outside of the building a mirrored look. For the project, we chose a spectrally-selective glazing. This refers to a window unit which transmits much of light in the visible portion of the solar spectrum, but limits transmission in the infrared and ultraviolet portions which cause overheating and fading of interior materials.
We selected PPG Industries’ Sungate 1000 solar control, low-E glass product with Argon gas fill. As shown in Table 2, this product has a SHGC of only 0.38, but with a daylight transmittance of 73%. The center-of-glass U-value is 0.24 Btu/hr · ft2 oF; we reduced heat transmission through the window frame by specifying white thermally broken vinyl frames (overall U-value = 0.35).
Table 2
Comparative Window System Performance Characteristics
| Air Space (in) | Glass Thick (mm) |
Unit Construct | Daylight (%) | Shade Coeff | Solar Heat Gain Coeff | U-Value Center-of- Glass |
R-Value Center-of- Glass |
Indoor Glass Temp Winter oF |
|||
|
Trans
|
Reflect
|
Wint
|
Sum
|
Wint
|
Sum
|
||||||
| — | 3.0 | Clear, monolithic | 90 | 9 | 1.00 | 0.85 | 1.11 | 1.03 | 0.90 | 0.97 | 16 |
| 1/2 | 3.0 | Clear & clear | 81 | 16 | 0.87 | 0.75 | 0.49 | 0.55 | 2.04 | 1.82 | 45 |
| 1/2 | 3.0 | Sungate 1000 (2) & clear | 73 | 12 | 0.45 | 0.39 | 0.30 | 0.30 | 3.33 | 3.33 | 54 |
| 1/2 | 3.0 | Sungate 1000 (2) & clear with Argon gas fill | 73 | 12 | 0.44 | 0.38 | 0.24 | 0.23 | 4.17 | 4.35 | 57 |
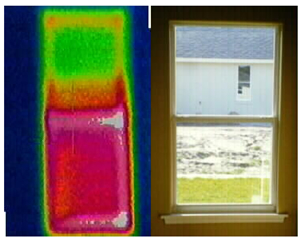
The improved glass has major implications for the required size for the air conditioning system. With 384 square feet of glass in our floor plan, Manual J showed a 7,700 Btu/hr difference (0.64 tons) in the required size of the air conditioning system – a large reason we are able to use an air conditioner half the size of that in the standard building. The windows provide excellent daylight transmittance as well as providing a color neutral appearance. Most visitors examining the PVRES home were unable to discern any visible difference in the appearance of the windows either from inside or out. However, the difference in the transmitted heat is clearly seen in the thermographic comparison shown in Figure 8.
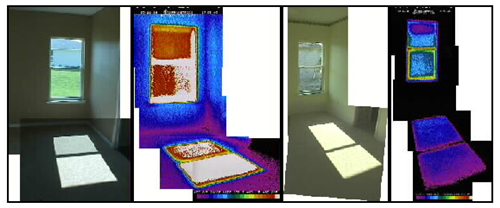
west-facing Control (left) and PVRES windows (right).
Reflective Roofing System
Over the last five years, FSEC has conducted numerous residential experiments showing that white roofs can reduce cooling energy needs [6]. The average cooling energy reduction based on tests in a dozen homes converted to white roofs was 19%. Based on testing performed at the FSEC’s Flexible Roof Facility in the summer of 1997, we learned that of the evaluated roofing systems (radiant barriers, added ventilation, white tile and white metal roofs), white tile provides the best cooling related performance of tested options [9]. Relative to a black asphalt shingle roof, a white tile roof produced a 76% reduction in overall summer ceiling heat flux (all test cells have R-19 ceiling insulation present). Moreover, when the outside summer air temperatures were at their peak the coincident peak attic air temperature difference which was 40oF lower in the white tile test cell (91.4oF) than the construction with black asphalt shingles (131.5oF). The measured attic air temperature is actually lower in the attic than the ambient air temperature until 2 PM in the afternoon on a typical summer day!
Both our test homes have R-30 fiberglass insulation blown in the attic, but two major differences for the PVRES home. The improved house features a white Mission concrete “S” tile roof – donated to the project by the Monier Company – to take advantage of its superior thermal performance. The control home’s roof is conventional: popular gray-brown asphalt shingles. We had both roof materials evaluated by DSET Laboratories; the solar reflectance of the Monier white S-tile tested at 77% while the reflectance of the gray-brown architectural asphalt shingle was only 7%.
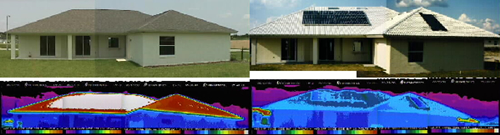
The tile roof was installed on the PVRES home in January of 1998. As expected, infrared thermography of the roofs (Figure 9) revealed major differences in the thermal performance of the two roofs. Figure 10 shows a plot of the measured attic air and ambient temperatures in the two homes on the utility peak day of June 18th. The attic temperature in the control house rises quickly in the afternoon to reach a maximum of 137.9oF at 2:30 PM while the white tile roof attic only reaches 100.2oF – just about the same as the ambient air temperature.
and PVRES homes on the utility peak day (June 18, 1998).
Low Friction Interior Duct System
An innovative design feature in the PV home is its low-friction interior mounted duct system. In conventional houses (including our standard home) the ducts are frequently undersized and are almost always located in the hot attic (Figure 11). Previous research has shown that air handlers located in the attic space can increase space cooling by up to 30% [10]. Tests at FSEC has shown that not only does the attic sometimes reach 135oF in Florida’s summers [14], heat transfer to the duct system can rob the air conditioner of up to a third of its cooling capacity during the hottest hours. The reason is simple: R-6 flex ducts contains the coldest air in the home (~60oF) while being exposed to the hottest temperatures; the area of ducts in a typical home is a third of the floor area. Heat transfer is proportional to surface area, thermal resistance and temperature difference: Q = UA (delta)T. At 130oF, and a 2,400 square foot home, this equates to over half a ton of air conditioning lost before cooling air reaches the registers.
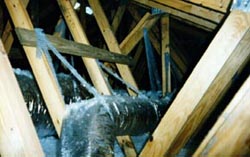
attic mounted duct system.
To avoid this problem, and to allow down-sizing of the PVRES air conditioning system, we designed the duct system so that it fits inside the conditioned space. Whatever heat is gained by the duct system is heat to be removed from the conditioned space. To hide the ducts, false dropped ceilings, lower cathedral sections and chases were used throughout the interior (Figure 12). To avoid problems with leakage, the duct system was carefully sealed with mastic and tested.

houses duct system in PVRES home.
Finally, we oversized the duct system, so that air flow resistance would be minimized. This not only provides critically important air flow across the evaporator, it also reduces air handler fan power and improves system efficiency while lowering noise. Such high air flow, low friction duct systems have shown to provide up to a 12% improvement in cooling system efficiency at essentially no cost [15]. Duct slide rules dominate the air conditioning industry with 0.1 inches water column (IWC)/100 ft equivalent length almost universally used to size ducts. Based on previous work, we found that using a friction coefficient of 0.05 IWC/100 ft will achieve the proper system air flow. A balometer mounted on the AH return air grill was used to verify that the target air flow was achieved (700 cfm/ton at full fan speed).
Interior Duct System

Perhaps the most innovative design feature in the PV home is its interior mounted duct system. In conventional houses (including our standard home) the ducts are located in the hot attic (Figure 1). Some houses even have the air handler located in this space (Figure 2). Previous research at FSEC has shown that not only does the attic sometimes reach 130oF in Florida’s summers, but heat transfer to the duct system can rob the air conditioner of upto a third of its cooling capacity during the hottest hours. The reason is simple: R-5 flex ducts contains the coldest air in the home (~60oF) while being exposed to the hottest temperatures; the area of ducts in a typical home is a third of the floor area (Q= UA dT). At 130oF, and a 2,400 square foot home, this equates to nearly a ton of air conditioning lost before it ever reaches the registers!

To avoid this problem, and to allow down-sizing of the PVRES air conditioning system, we designed the duct system so that it fits inside the conditioned space. Whatever heat is gained by the duct system is the heat that is removed from the conditioned space. To hide the ducts, false dropped ceilings, lower cathedral sections and chases were used throughout the interior (Figure 3). To avoid problems with leakage, the duct system was carefully sealed with mastic and tested. Finally, we oversized the duct system, so that that air flow resistance would be minimized. This not only provides critically important air flow across the evaporator , it also reduces air handler fan power and improves system efficiency and reduces noise.
Duct and House Airtightness
We used a Duct Blaster (The Energy Conservatory) testing device to determine the relative leakage in the return and supply sides of the duct systems in both homes. In the Control home, the total CFM25 leakage of the duct system from outside the conditioned space: 122 CFM25. Given its 2,425 square feet of conditioned are, the duct leakage to outside is 0.05 cfm/ft2. This compares to the 0.03 cfm/ft2 proposed as a standard for utility new homes programs. In the PVRES home, the total CFM25 leakage of the duct system from outside the conditioned space was 50 CFM25 or about 0.021 cfm/ft2– a low value. In summary, we found that the tightness of the duct system of the Control home was very average relative to most homes which we have tested. One limitation of the tests, however, is that with the air handler operating, all leaks are not the same. Ceiling penetrations close by the air handler can bring air from the attic — air that is super heated in the Control home. The PVRES home with its interior duct system, on the other hand, had as low a leakage to the outside of the building of any that have been tested by FSEC. Moreover, any of the 50 cfm air that is unintentionally drawn from the attic is being taken from a space that typically gets no hotter than the outside ambient air temperature.

We also used the Minneapolis blower door to measure house tightness in both homes. For the Control home the total overall building tightness of the control house was 2025CFM50 or 6.3 ACH50 with a house ELA of 95.2 square inches. The overall tightness of the PVRES home was 1587 CFM50 or 4.9 ACH50 with a house ELA of 69.0 square inches. A technical discussion of blower door data and its uses can be found in an on-line publication available from LBNL. In both homes, we noted that much of the leakage to the outside appears to be from the 30 recessed lighting cans in the ceiling. For Central Florida’s climate, a useful rule of thumb to determine the house natural air infiltration rate is to divide the house ACH at 50 pascals by 30. This indicates a typical natural air change rate of about 0.16 ACH in the PVRES home and 0.21 ACH in the Control.
Our test results indicate a fairly tight building envelope for both homes, with the PVRES home somewhat better. However, the leakage duct systems for the two homes show large differences, mainly due to the interior duct system in the PVRES site. Moreover, thermography showed that the leakage from the attic to the air handler at the Control site has a potentially disproportionate impact on cooling efficiency.
Project Economics
The objective of the project was to explore how the maximum feasible energy savings in a new Florida residence would perform when combined with PV electric power. As such, the project was research oriented and was not intended to be economic. Nevertheless, in cooperation with the builder we did track the cost of the various measures installed so that relative assessment of economic performance could be performed.
Table 11
Incremental Cost of Efficiency Measures in PVRES Home
Cost Differences vs. Control
| Component | $ Incremental Cost |
| Advanced Windows (Materials) | $ 4,026* |
| Advanced Windows (Added Labor) | $ 240 |
| White Tile Roof (Labor) | $ 5,301 |
| White Tile Roof (Materials) | $ 5,528* |
| Wider Overhang | $ 1,882 |
| High Performance AC | $ 1,263 |
| Interior Duct System | $ 950 |
| Exterior Wall Insulation | $11,500 |
| Propane lines & gas appliances | $ 479 |
| Solar Water heater w/propane backup | $ 2,989 |
| High Efficiency Lighting | $ 525* |
| Programmable Thermostat | $ 225 |
| Refrigerator | $ 298 |
| Total | $35,206 |
| Total less donations* | $25,127 |
Also, since measures were combined in a single package, it was necessary to use the DOE-2.1E building energy simulation (Energy Gauge USA) to estimate the relative contribution of the various measures. This was done by tuning to the model to reflect the actual conditions encountered (air handler leakage from the attic, unshaded windows etc.) and then using the model to estimate savings for the various measures.
The results of the parametric analysis used for this estimation is shown in Table 12. Starting with the base building, we analyzed how each measure influenced measured heating and cooling energy use. We then used each measure’s results to predict the portion of the cooling savings coming from that particular measure. The simulation worked reasonably well at predicting the relative performance of the two buildings. Using the July TMY values for the extreme weather conditions seen in June of 1998, Energy Gauge USA predicted the Control home to use 60.5 kWh per day for cooling against the 61 kWh/day which was measured. When blinds were assumed in the PVRES home (as operated), the model predicted cooling energy consumption of 19.4 kWh/day against the 15.6 kWh which was measured in June. Overall, the model predicted the PVRES house would use about 68% less for cooling in June against the 74% savings actually measured.
Table 12
Parametric Analysis of Heating and Cooling Energy Use
in the PVRES Home DOE-2.1E Simulation
| Case | Fan | Heat | Cool | Total Heat | Total Cool | Total | % Cool Reduction |
| Base | 1338 | 1,068 | 8,915 | 1,211 | 10,093 | 11,321 | 0.0 |
| Hi Perf Windows | 1,005 | 619 | 7,072 | 700 | 7,986 | 8,696 | 20.9 |
| White Roof | 1,115 | 1,119 | 7,376 | 1,266 | 8,328 | 9,610 | 17.5 |
| R-10 Walls | 1,297 | 945 | 8,539 | 1,074 | 9,691 | 10,781 | 4.0 |
| 3 Ft Overhangs | 1,255 | 1,043 | 8,271 | 1,184 | 9,369 | 10,569 | 7.2 |
| House Tightness | 1,317 | 988 | 8,626 | 1,123 | 9,791 | 10,931 | 3.0 |
| Duct Tightness | 1,207 | 993 | 8,101 | 1,125 | 9,161 | 10,301 | 9.2 |
| Hi-Effic. AC | 1,367 | 319 | 5,709 | 391 | 6,988 | 7,395 | 30.8 |
| Interior ducts | 1,202 | 928 | 7,508 | 1,060 | 8,561 | 9,638 | 15.2 |
| PVRES (All) | 655 | 347 | 2,868 | 418 | 3,440 | 3,870 | 65.9 |
| PVRES w/blinds | 606 | 376 | 2,673 | 451 | 3,192 | 3,655 | 68.4 |
We then used each measure’s results to predict the portion of the cooling savings from each particular measure as illustrated in Figure 57. This method has some important caveats, however. Many of the individual measures strongly interact with each other. For instance, duct tightness and interior duct location are strongly linked; also white roofs save considerably more when the ducts are located in the attic space. Wide overhangs save more when unimproved single glazed windows are assumed (and vice versa). All measures save less, once the high performance air conditioning system is assumed (the largest single savings measure). Regardless, the results do indicate the relative influence of the various improvements. We used results directly from the simulation for the lighting and water heating measures which did not involve heating and cooling.
Table 13 shows the results on combining the cost and performance data from the above analysis for the various measures to estimate relative economics.
Table 13
Preliminary Economics of Efficiency Measures
| Component Description | Cost ($) | Savings kWh ($) |
Simple Payback (Years) |
| Advanced Windows | $ 4,266 | 1,610 ($129) | 33 |
| White tile Roof | $10,829 | 1,342 ($107) | 101 |
| R-10 Walls | $11,500† | 307 ($ 25) | 460 |
| Wider Overhang | $ 1,882 | 537 ($43) | 44 |
| Interior Duct System | $ 950 | 1,150 ($80) | 12 |
| High Efficiency AC | $ 1,263 | 2,376 ($190) | 7 |
| Efficient Lighting | $ 525 | 1,479 ($118) | 4 |
| High Effic. Refrigerator | $ 298 | 388 ($31) | 10 |
| Solar Water Heater | $ 2,989 | 2,097 ($123)* | 24 |
| Utility Integrated PV System | $40,000 | 5,600 ($448) | 89 |
† Cost of the wall system was very large due to cost increases associated with a first time installation of the system. A mature market would be able to achieve half this cost.
* Computed on the basis of 37.8 gallons per day raised from 75 to 130oF with an EF = 0.88 base tank.
Annual back-up propane consumption estimated at 32 gallons.
Since the project was a technical research demonstration project, a number of the items did not appear cost effective. However, several measures were economically attractive, including both an interior duct system and a high efficiency air conditioner, high efficiency lighting and refrigeration.
Also, it must be pointed out that there are side benefits for some components. For instance a tile roof will have greater longevity than a shingle roof which makes the energy related savings a cost-effective by-product. Also, advanced insulated window units, such as those utilized in the project, will produce a more quiet home interior with rooms that are less prone to uneven temperatures during very hot or cold periods.
Further, there are construction methods by which the cost of the various measures might be considerably reduced over those experienced within the project. A fundamental scheme is to use surround porches in an altered building plan to keep solar radiation off walls and windows to allow for less rigorous treatment of these building components. Other strategies are to use less expensive white metal roofing and an integrated storage water heater. Potential cost reductions are summarized in Table 14:
Table 14
Potential Cost Reductions for Selected Measures
| Measure | Cost | Potential Cost Reduction or Improvement |
| Advanced Windows | $4,266 | Utilize building plan with surround porches with insulated tinted glass Drops added window cost to ~ $1700 |
| White tile roof | $10,829 | White metal roof Drops added cost to ~$3,500 |
| R-10 walls | $11,500 | R-5 interior wall insulation Drops added cost to ~$400 |
| Solar Water Heater | $2,989 | Use integrated storage solar water heater Drops added cost to ~$1,600 |
Through such an altered floor plan, it would be possible to reduce the incremental cost of the various improvements by over $22,000 and considerably improve economics while preserving the identified level of performance. The surround porches have a cost, but they also result in very useful exterior living space. Covered areas are of considerable amenity in Florida’s climate where direct sun or afternoon rains can otherwise abbreviate outdoor activities. This is essentially a modern embodiment of “Cracker style” scheme utilized by the pioneers in Florida at the turn of the Century prior to the advent of air conditioning [12].
Based on a side-by-side evaluation, energy efficient housing incorporating utility integrated PV power can reduce total electrical consumption by 70% or more over traditional housing. Results also demonstrate that PV can be a viable means to eliminate the peak load posed by the cooling system on the utility during its coincident peak demand period.
Lakeland Electric & Water experienced their annual summer peak power demand at 5 PM on June 18th, 1998. On this day, the occupied PVRES home showed dramatically lower cooling and total electricity requirements than the unoccupied control house. Over the 24 hour period, the PVRES home only used 28% of the air conditioning power that the Control required. During the utility coincident peak period the Control home air conditioner required 2,980 Watts as opposed to 833 W for the PV home – a 72% reduction. Moreover, when the PV electric generation is included during the peak period, the PVRES home net demand was only 199 W – a 93% reduction in electricity requirements over 3 kW required for the control home.
The project had successfully demonstrated its fundamental objective – the ability to greatly reduce space cooling loads and when matched with PV electric power production, to bring the house utility coincident peak demand close to zero. Under matched unoccupied conditions during several hot weeks in May 1998, space cooling energy use was shown to be reduced by 84%. Moreover, average PV power production to the grid averaged 17.1 kWh/day over a 26 day period from April 22nd to May 17th. With the control home this level of power production would have provided less than half the electricity used by the cooling system, while in the efficient PV home, three times as much electricity was produced as the cooling system used.
Even during June’s extreme heat wave, reduction in air conditioning use was over 70% even with the PVRES home occupied and the Control unoccupied. When solar electric power production was included, the PVRES home had a net electric demand on the grid was near zero. On the utility peak day of June 18th, the PVRES project conclusively demonstrated it is possible to build very efficient homes in Florida with PV which exert little net demand on the grid during utility coincident peak periods.
Addition of a Swimming Pool
A very large change in the electrical loads on the PVRES building took place on August 11th. On this day, construction on the new 14 x 28 ft 14,000 gallon pool was complete and the circulation pump was energized. The pool includes a one horsepower pump which has a 1.6 kW electrical demand. A pump of this size was added in spite of the use of low friction 2″ piping for the pool circulation installed. Currently, the pool pump’s daily consumption comprises the largest electrical load at the site – with approximately 12.5 kWh/day used during its 7.5 hours of operation from 10 AM to 5 PM. Figure 58 shows the pool pump load profile over the month of September. Daily PVRES household electrical consumption increased from 30 kWh/day to over 42 kWh/day after the pool was installed. FSEC is exploring methods in which pool pump power might be reduced through the use of two speed pumps or other means to cut this load.
Control Home
The control home remains unsold, but is shown to prospective customers on Sundays. On August 16th the temperature inside was altered so that a maximum temperature of 80oF is maintained. Project members intend to reset the Control home thermostat in the near future so that comparable temperatures are maintained to that in the PVRES home.
Our future objectives for the project include:
- Determination of comparative performance after the Control is occupied
- Long term assessment of utility interactive PV performance
- Load reduction of pool pumping electrical load in PVRES hom
Based on findings within the project, the following methods are suggested to enhance concept performance and improve cost effectiveness:
| Improves Performance | Impact |
| Greater fraction of tile flooring the floor plan | Greater use of ground as a heat sink |
| Use sealed recessed cans for ceiling fixtures | Reduces house air leakage |
| Use greater portion of PV array on west face | Improves peak period power (2 kW) production |
| Consider higher efficiency water to air | Improves cooling efficiency by heat pump 10%-20% |
| Reduces Costs | |
| Use white metal rather than white tile roof | Reduces incremental cost of roofing and simplifies PV installation |
| Use R-5 insulation on interior of masonry walls | Greatly reduces wall insulation cost |
| Use large diameter flex duct for interior ducts | Simplifies sealing and reduces cost |
| Use integrated storage solar water heater | Single tank system reduces cost |
This project represented a very large effort by many individuals, firms and institutions – a fact reflected in its accomplishments. Special recognition goes to the project sponsors: Sandia National Laboratory, the Florida Energy Office and Lakeland Electric and Water Company. The project would not have been possible without the cooperation of Rick Strawbridge of Strawbridge Construction and his able assistants, Mr. Gary Morrison and Ms. Maureen Warren. Many companies and their representatives also assisted with acquiring superior efficiency products for the project: Dick Edwards of the Celotex Corporation (exterior wall insulation system), Pat Kenny of Pittsburg Plate Glass (advanced windows), Rod Hirschberger of PGT/VinylTech (window fabrication), Keith Wesche of Monier Tile (reflective roofing tiles), Mark Adams and Keith Ledford of the Trane Company (high efficiency air conditioner), Tim Rice of Ward’s Air Conditioning (cooling system installation and interior duct system), Wayne Wallace of Solar Source (solar water heating system), Don Lewinski of Panasonic Corporation (high efficiency lighting), and Maggie Baker with Sears contract sales (efficient side-by-side refrigerator). With Lakeland Electric and Water, thanks to Bob Reedy, Jeff Curry, Al Lukhaub and Mimi Fernandez. At FSEC, thanks to Mike Murden for assisting with the PV system wiring and Kevin Lynn and Brian Farhi for assisting with module assembly and testing. Dr. Jerry Ventre provided able overall direction for the project. Finally, our sincere appreciation to the new owners of the PVRES home, Harry and Nancy Adam, for their continued patience.
Floor Plans
HVAC
Air Conditioning Equipment
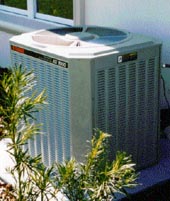
An important objective in selecting the cooling equipment for the PVRES home, was to take advantage of the features designed to reduce cooling loads. We used RHVAC (Elite Software) to calculate the cooling system size for both the standard home and the control home. RHVAC uses Manual J for its calculations. We entered the building features for either house in detail (walls, roof, glass, duct system etc.), but as a conservatism we chose an 95oF outdoor design temperature rather than the 91oF, suggested by Manual J, along with a 75oF interior temperature. The Manual J calculations indicated a cooling system of 3.88 tons for the standard home (4 tons) and 1.73 ton (2 tons) for the PVRES house.
Although, the two ton system for such a large home (2,425 square feet) is highly unusual, Ward’s Air Conditioning in Lakeland and the Orlando and Tampa Trane offices worked with FSEC to come up with a suitable system. In a related project, we had a very good experience with Trane’s XL 1400 series air conditioner [16]. Consequently, we selected the TWY024A two-ton heat pump for the project. We used the TWE040E13 variable speed indoor air handler to provide optimum efficiency, humidity removal and quiet operation. The Seasonal Energy Efficiency Ratio (SEER) of the combination is 14.4 Btu/W; the analogous Heating Season Performance Factor (HSPF) is 8.5 Btu/W. For the standard home we utilized the a standard efficiency 4-ton Trane heat pump which the project builder typically installs in his homes – a TWR048C (SEER = 10.0 Btu/W; HSPF = 7.0 Btu/W). The two units are shown in Figure 20; note the larger size of the condenser for the smaller, more efficient unit at the PVRES house.
Air Conditioner Performance Testing
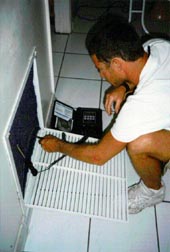
After each air conditioner was installed, we performed tests on April 8, 1998 to establish the relative performance of each. We developed a procedure entirely based on physical measurements, that can be used to measure the instantaneous efficiency of a cooling system. First the dry coil air flow is determined by turning on the heat pump back-up resistance heat elements and measuring the temperature rise across the heating coil. We used a portable Cooper Instrument Corp. SH66A multi-probe digital thermometer to do take this measurement (Figure 21). By simultaneously measuring the element wattage (we turned off all non-AC breakers and measured this using the utility meter), the air flow cfm can be gauged through knowledge of air’s specific heat and density. As a check, we used a Shortridge flow hood to verify the estimate obtained by the resistance heat method (Figure 22).
Secondly, the air conditioner is set on to cooling and the temperature drop measured across the coil. Within the tests, we used two temperature probes before and after the coil. One set of the probes recorded the dry bulb temperature. The other two probes had water saturated cotton shoe-laces inserted into the air stream to measure the wet bulb temperatures before and after the coil. This would allow determination of the AC latent performance by looking at the change in enthalpy across the evaporator coil. As a check on this measurement, we also collected air conditioner condensate over a ten minute period once flow had begun. Finally, an outdoor temperature is taken at the condenser inlet since the rated EER of units is typically based on this condition and that indoors.

The product of the change in enthalpy across the evaporator coil times the measured air flow yields the total cooling. By measuring the power demand of the AC system, the system energy efficiency ratio (EER) is obtained.
The measured air flow for the four ton heat pump at the Control house was 1,555 cfm or about 390 cfm/ton. This is well within the tolerance established for the air conditioner (400 cfm/ton). A 16.5 degree temperature drop was measured across the coil (Treturn = 69.2o; Tsupply = 52.7o; Treturn, wet = 59.4o; Tsupply, wet = 50.8o). The measured sensible cooling capacity of the unit at a 77.4o degree outdoor temperature was 26,680 Btu/hr; the latent cooling capacity was 8,560 Btu/hr for a total capacity of about 35,240 Btu/hr. With a 4,181 Watt power draw; this works out to an EER of 8.4 Btu/W. This is short the nominal SEER of 10 Btu/W, but the indoor temperature was much lower (69.2oF) than the 80o assumed in the ARI test procedure.
The test at the PVRES home was done with the variable speed air handler (VSAH) operating at full speed. The unit was configured with the VSAH operating much of the time it operates at less than half speed since measured on cycles last about six minutes.
Lighting

Like most new homes in the 1990s, the PVRES floor plan features lots of lighting from recessed cans — thirty in all as shown in the top photo. In the standard home, each of these contains a 75W R-lamp incandescent bulb. That’s a connected lighting load from recessed cans alone of 2.25 kW! Previous research at FSEC has demonstrated the large savings potential of using compact fluorescent lamps.
Our standard home will use the standard lamps. However, for our PVRES home, we took advantage of available technology from the Sylvania Corporation. They provided three dozen Sylvania Dulux EL15W lamps, shown in the bottom photo, for installation in the recessed cans of the PVRES home. The lamps fit wherever a standard R40 lamp will fit. It provides virtually identical light output to the 75BR30 lamp and uses only 15 watts (600 Lumens) rather than 75. It also lasts an average of 10,000 hours of use rather than 2,000 for a standard incandescent lamp and thus will seldom need changing. Best of all, we will cut the installed lighting demand by almost 80%.
End-Use Monitoring
Thermal Performance Monitoring
The construction of the Control home was complete before the PVRES home. However, as soon as we were able to go inside the completed PVRES building after being inside the Control home, we noticed that the improved structure seemed much cooler inside.
So, as soon as the data aquistion system was in place we began comparative monitoring of the thermal performance of the two homes (Control and PVRES). We turned off all appliances in both homes and closed them up and recorded data for a five day period (April 16th – 20th) in an unoccupied and (mostly) unconditioned state. The data loggers recorded the the weather conditions and temperatures around the homes.
- Ambient air temperature outside
- Interior air temperature by the thermostat
- Temperature of the floor slab at a 2″ depth
- Attic air temperature
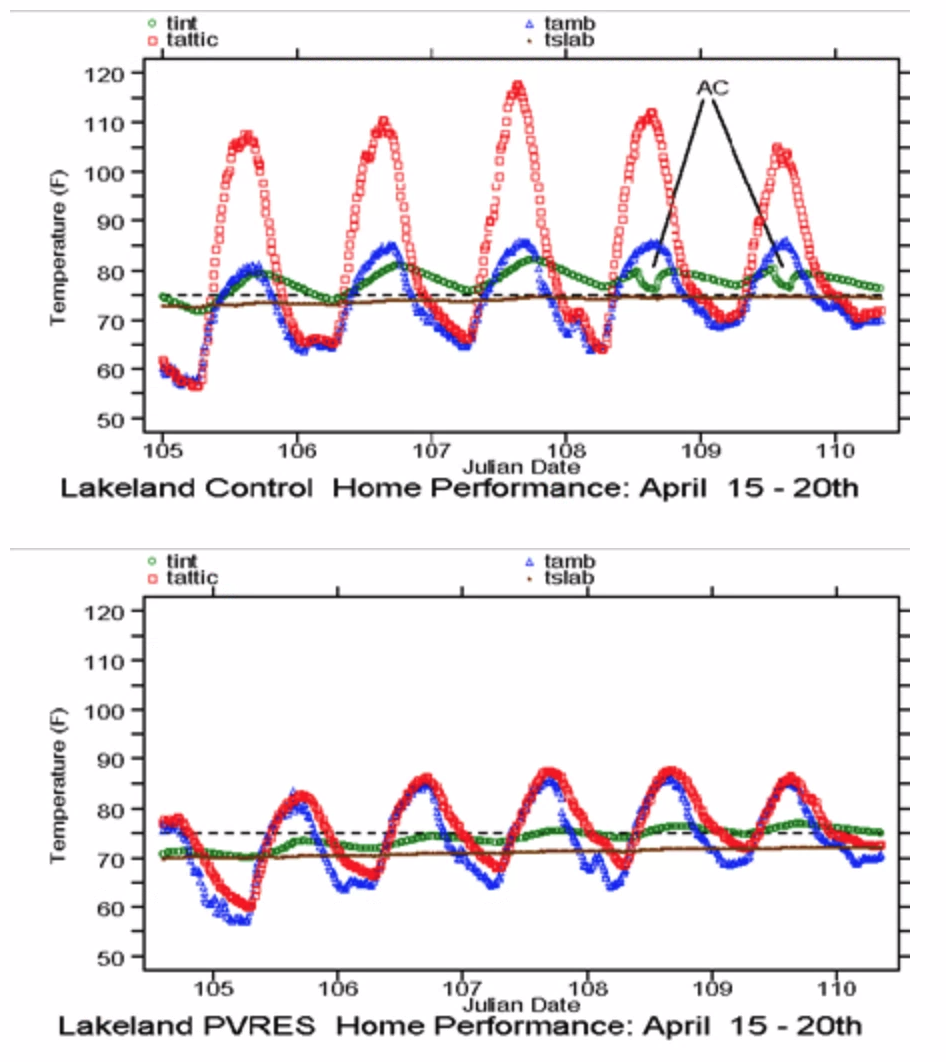
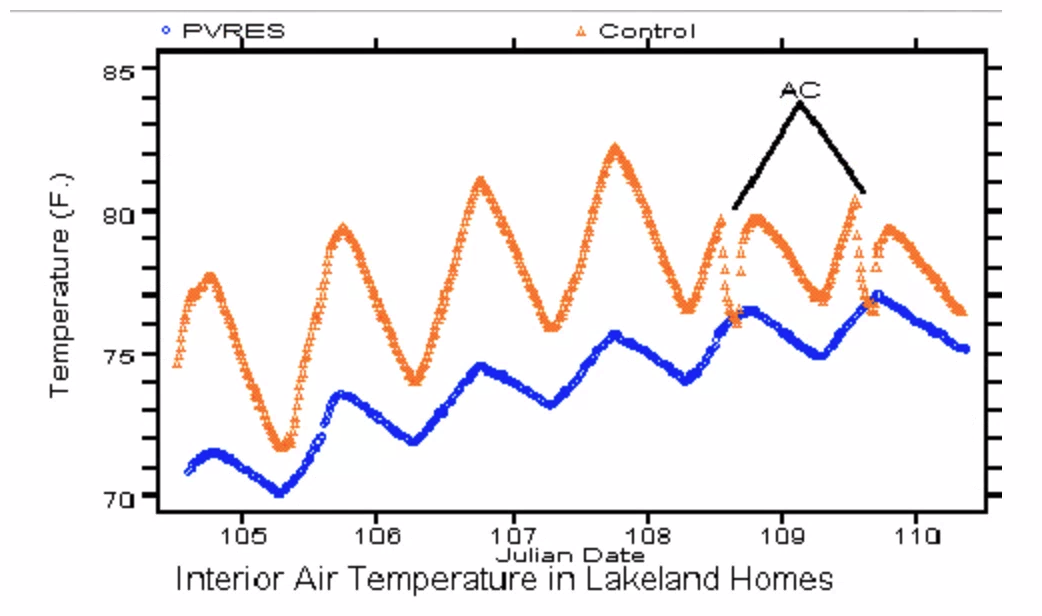
Note the large differences in the attic air temperatures in the two homes– even in mid April. The attic air reaches nearly 120°F in the Control home under its dark brown shingles while the attic under the white tile roof ranges only slightly around ambient air temperature. The interior air temperature in the PVRES home shows much less daily variation than the Control home. The comparison shows that the PVRES home averaged 4.3 degrees cooler (73.1° vs. 77.4°) than the Control home and was always cooler except on Saturday and Sunday when the Control home was air conditioned for several hours by a real estate agent in order to have the interior cool enough to show to prospective buyers (although the PVRES home is sold, the Control home is not). Interestingly, the air conditioning of the Control home was only able to slowly bring its temperature down to the temperature that the PVRES interior was floating at without air conditioning! During “float” conditions, the temperature also was less variable in the improved home– ranging only from 70.1o to 75.6°F (5.5° difference) vs. 71.7° to 82.3°F (10.5° difference) in the Control.
Analysis showed that the long term temperatures in both homes slowly rose, because of the slow increase in daily air temperatures, but particularly because of the rise in the ground temperature as reflected in the steady increase in slab temperatures in the first two plots.
In summary, our base monitoring of the thermal performance of the envelopes of the two buildings showed large differences between the two– a reflection of the influence of the cooler attic, the exterior insulation on the PVRES home and its high performance windows. So successful did these features appear in concert, that the PVRES building showed little need for air conditioning while the Control required mechanical cooling to keep its interior temperatures below 80°F.
Preliminary Measurements of Comparative Cooling Performance
Plotted below are the comparative AC loads and interior temperature at the PVRES and Control homes over the first four days with both systems set into cooling mode (April 23rd – 27th, 1998). The thermostats were both carefully set to maintain 72oF inside. Since the temperature in April in Central Florida is mild, we set the thermostats artificially low to attempt to emulate the temperature differences that will be seen during warmer weather.
The PVRES home maintained an average interior temperature of 71.5oF against 70.8oF inside the Control home. The main reason for the lower temperature in the Control home was that the nighttime temperatures fell lower without the better wall and window insulation levels– note that during daytime hours the 4-ton AC at the Control home had difficulty keeping up with the load. The total AC consumption (compressor and air handler) was very different: an average of 19.57 kWh/day in the Control home against 1.79 kWh/day in the PVRES home. The AC consumption in the PVRES home was lower by more than an order of magnitude!
Here is data for the Control home (RED is AC power; BLUE is the interior air temperature):
And here is the same data for the PVRES house (ORANGE is AC power; GREEN is interior air temperature):
Likely, the differences seen here will not be as large during the hot days of summer. Also, the differences are certain to be less when the homes are occupied and have internal loads. Regardless, these results show that we can engineer homes for Florida which use a fraction of the cooling energy relative to how we build now.
Initial PV System Performance
The photovoltaic (PV) solar electric generation system is grid-interactive, producing DC power which is inverted into AC current and then fed directly into the local utility feeder of Lakeland Electric and Water Company. During the first week in which thermal conditions were monitored in the two homes, the initial PV system performance was tracked. The PV system had been in operation for about 10 days when monitoring began.
The first figure below shows the AC power (watts) sent to the grid by the PV system over several days in April, 1998. Sky conditions over the period varied from sunny to cloudy with rain. Over this period, the average daily net power to the grid was 15.2 kWh with a peak 15-minute power production of 3.0 kW. On average, the daily PV output peaked at 1:45 PM EST.
Since installation, performance of the PV system has been as expected. One observation from review of the data is that the maximum produced power (3.0 kW) is less than the nominal 4.05 kW of the installed system. This is due to a number of factors– all expected. The first reason is that the nameplate value (75 W) of each of the 54 modules output is slightly optimistic relative to what will be seen in a typical field installation. In actuality, mismatch losses, wiring losses and even array surface soiling will see the actual power production about 5% less than the nameplate rating.
Secondly, the power production performance of the PV modules is dependent on the array temperature. The higher the panel temperature, the lower the solar to electric conversion efficiency. The PV modules installed experience a 0.4% drop in nominal output power for each degree centigrade which the arrays are warmer than 25°C. The first week of recorded data shows that module temperatures averaged 55°C under full sun (1000 W/m2). This would indicate the power production performance would be about 88% of the nameplate value.
Thirdly, approximately 1.35 kW of the 4 nominal kW installed faces west. We intentionally installed with this segment to explore how this would assist in meeting late afternoon peak electrical needs for the home. Regardless, its peak power production is somewhat out of phase with that of the larger south facing array (the reason why the observed system peak output is at 1:45 PM rather than solar noon). When the south system is seeing an insolation level of 1000 W/m2, the west portion will be seeing less and thus produces less total peak power. The ratio on the two orientations will change seasonally, but the insolation from the west array averaged 880 W/m2 when the south array was receiving 1000 W/m2. Of course the west array is of advantage in the later afternoon; for example, at 6 PM EST when many homeowners are coming home and turning on appliances, the insolation on array tilt averaged only 133 W/m2 on the south array while it was 354 W/m2 on the west array. This advantage is illustrated graphically in the recorded solar irradiance data from a clear day on April 25th. The plot shows that although the total daily irradiance on the west facing array was about 5% less than that on the south, together the south and west array segments help to broaden the potential power production throughout the later afternoon hours.
Finally, there are losses in the inverter conversion efficiency from DC to AC current. Since we measure the array current and voltage output to the inverter and were able to estimate this conversion efficiency over the initial monitoring period to average approximately 89%.
All of the above factors work together to bring the expected peak power production down to approximately 3 kW. This understood, the initial performance of the PV system has fully met expectations, producing AC power dependably for the utility without incident. Further, with the efficiency of the PVRES building, we should have enough power produced to meet most of the daytime net energy needs of the home.
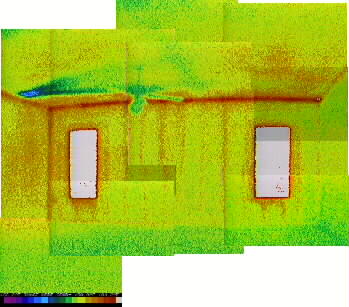
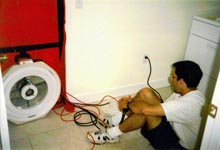
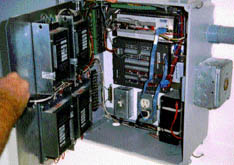
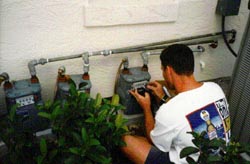
In April of 1998, both the PVRES home and the control site were fully instrumented with a Campbell Scientific CR10 data logger to both measure weather and thermal conditions as well as total electrical load and to isolate each of the major end-use loads. The photo below shows the enclosure logger during installation and wiring. The data logger itself is the small silver box at the top of the enclosure; the large flat wiring panel below the data logger is the AM416 multiplexer which allows the collection of the large number of analog measurements necessary in the project. A SW8A pulse count board (top of the enclosure) allows storage of the numerous switch-closure measurements on site. The series of boxes on the swing door are the individual Ohio Semitronics watt-hour transducers that measure the power consumption of the various appliances. Each of the following electrical end-uses were individually metered:
- Total electricity
- Air conditioner
- Air handler
- Hot water
- Refrigerator
- Range
- Dryer
- Washer
Miscellaneous loads, including lighting and ceiling fan use are tracked by subtracting the major electrical end uses from total. Thus, if lighting loads were altered, the differences in the estimated miscellaneous loads could be used to estimate lighting energy savings based on a pre and post retrofit monitoring protocol.
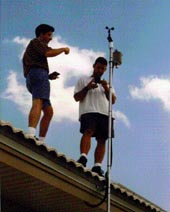
In addition, a weather tower was installed to obtain data on ambient air temperature, relative humidity and solar irradiance. Wind speed is obtained by an RM Young anemometer; solar irradiance is obtained from Li-cor silicon cell pyranometers. Ambient and indoor relative humidities are taken by Vaisala hygrometers. Temperatures were taken in a variety of locations throughout both homes to characterize thermal performance.
All temperatures are taken with Type-T thermocouples (0.1F accuracy):
- Ambient air temperature
- Roof surface temperature
- Decking surface temperature
- Attic air temperature
- Interior air temperature by thermostat
- Return air temperature (just before the coil)
- Supply air temperature (just after the coil)
- Supply air temperature at closest register
- Supply air temperature at far register
- Slab temperature (2″ depth)
- Garage temperature
- Cold water line inlet temperature
The temperatures taken before and after the air conditioner coil allow characterization of cooling system performance; the temperatures taken at the near and far registers should allow assessment of heat gains to the duct system in the Control home. Other unique information is taken at the PVRES home to characterize the PV system performance:
- Array plane solar irradiance (south)
- Array plane solar irradiance (west)
- Array center temperature
- PV DC output voltage
- PV DC output amps
- AC inverter output Watts
Also, the PVRES home has propane used for its range, dryer, a fireplace and back-up for the water heating system. The consumption of the individual propane appliances is recorded by signals sent from the data logger by pulse-initiating AC-250 propane meters graciously provided by the American Meter Company.
All of the data channels in both houses are scanned every ten seconds with integrated averages output to storage each 15-minutes. The resulting data is then sent to FSEC over dedicated telephone lines each evening. Detailed plots are created for each day of the monitoring project. See the updates this month for the PV system and the thermal performance monitoring to see samples of what is being recorded.
Overhangs Can Make a Difference
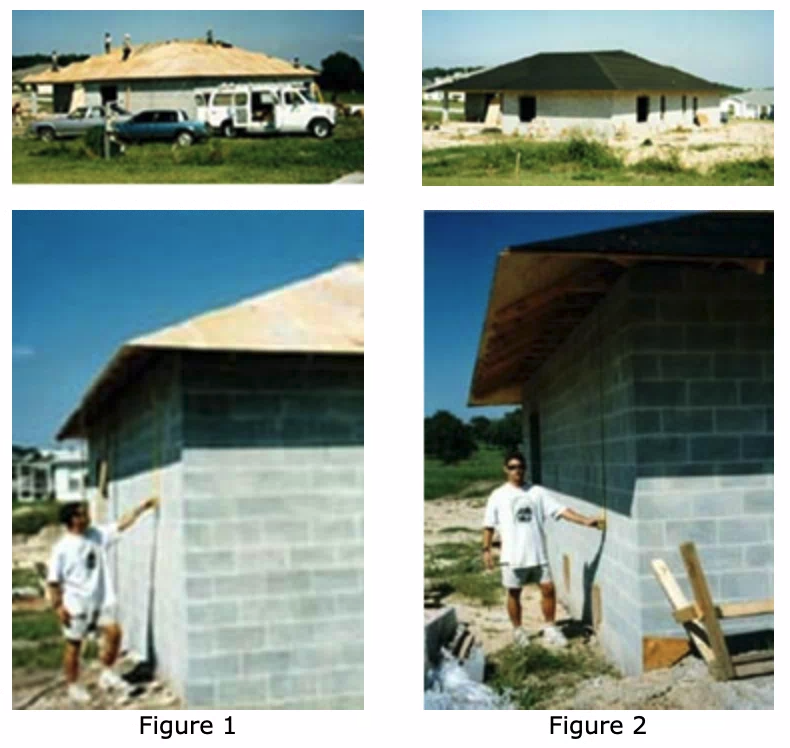
Overhangs are a fading architectural feature in modern Florida housing. In the original “Cracker” homes built at the turn of the century before air conditioning, wide porches and deep overhangs were considered essential to beat the heat in Florida. But with the advent of air conditioning, many new homes have sacrificed overhangs in interest of first costs. Modern developments often have next to no overhangs on new residences. But what saves initially doesn’t always save over the long run.
Overhangs are one of the architectural differences between the two homes in the Lakeland project. The PV home has a 3 foot overhang around the perimeter of the building (Figure 2)while the standard home has one and a half foot overhangs. The four figures on the right show the difference an overhang can make on our project homes. In the photos, FSEC engineer John Sherwin measures the length of the overhang shadow along the south wall of the two homes at 11:10 AM on October 1st, 1997. The standard home, shown in Figure 1, with 1.5 foot overhangs shows a shadow length of just 36 inches— barely enough to reach the tops of the window. At the same time, the shadow on the PV home, shown in Figure 2, is 72″ long which a perspective photo shows covers over 75% of the south and east windows as well as much of the wall.
Everyone in Florida knows that unshaded windows can really heat up the interior. The three foot overhang in the PV home is just a small improvement which we made using a very old idea to achieve better performance.
Utility Interactive Photovoltaic System

FSEC researchers developed the specifications for a utility interactive photovoltaic system to be used during this study. Hutton Communications, Inc was selected as the systems integrator and was tasked with providing a ready-to-install kit. Hutton selected the system components including the photovoltaic modules and power conditioner. They provided assurance of compatibility between the various products and supplied the balance of system components, which included schematics for the electrical connections, junction boxes, fuse blocks, and lightning suppressors.
Sizing the Photovoltaic Array:
The PV generation system was sized to provide power that would offset most of the daytime household electrical loads. Simulation models provided an estimate of the usage and the PV array output. Based on the predicted loads for a peak day, it was determined that a 4kW solar array should be installed. The simulations indicated an array this size would match the anticipated electrical demand of the house for approximately eight hours on hot summer day. However, the available south-facing roof area did not meet the size requirements of a 4kW array. It was determined that the array would be split into two sub-arrays, one facing south and the other facing west. This setup allows the total number of modules installed to remain the same, but significantly changes the power generation profile. The models indicated that the west-facing array would produce slightly less power than the south array over the year. However, predictions also indicated the west sub-array would generate appreciable power later in the day when residential loads are greater and, after the output of the south sub-array had diminished.

A Utility Interactive System:
The photovoltaic system in this study will be owned and maintained by the electric utility company (Lakeland Electric and Water) and the power generated is supplied to the utility side of the meter. The output of the system is monitored by the utility company to evaluate the system performance and to troubleshoot problems. Systems installed such as this one increases the capacity of a service provider and can help reduce the total operating hours required for fuel-burning generators.
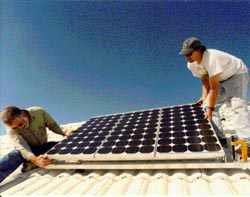
Photovoltaic Modules:
Siemens SP75 solar modules were selected for installation on the roof of the house. These single crystalline modules have a maximum power rating of 75W and have a selectable voltage of 12V or 6V. Bypass diodes are installed in each module to minimize the power loss due to partial shading. The photovoltaic arrays were installed in panels, each comprised of three modules connected in series. Thirty-six modules or 12 panels make up the south-facing sub-array and 18 modules or six panels face west.
Inverter/Power Conditioner:

A SW4048UPV sine wave AC power inverter from Trace Engineering was selected to convert the DC from the array to AC and interact with the utility grid. This inverter has a 240VAC – 60Hz output and provides high quality sine wave energy, which is required for utility line-tie applications. Ground-fault interrupt circuitry is provided for protection and the unit shuts down automatically when utility power is lost.
The PV system is extensively monitored with instruments to evaluate the performance and compare the actual power output with the simulation models. This system and others like it will be part of a pilot program to determine the feasibility of the solar rooftop systems as distributed generators for utility companies in Florida.
Our Quest for a SERP Refrigerator
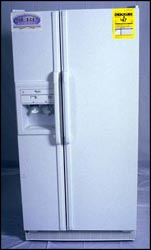
For the project we were determined to locate one of the Super Efficient Refrigerator Program (SERP) units since we had seen how well they perform in a previous monitoring project. The 25-cubic foot side-by-side refrigerators feature an advanced compressor, vacuum panel insulation and fuzzy logic defrost control. They also use very little electricity compared with most models with through-the-door features. Unfortunately, the model we needed, the ED25PS, had been discontinued and Whirlpool had no more in their warehouse. Luckily, we got in contact with Sears. Whirlpool had produced a copy cat of the ED25PS, the Kenmore 55792. Unfortunately, we soon discovered that the unit could only be sold in the service territory of utilities that sponsored its development. But fortunately, we got in contact with Josephine Mestas, in Consumer Relations with Sears. In some impressive sleuthing, Josephine tracked down one of the Kenmore units on the sales floor in San Leandro, California. We then had the unit shipped direct from Sears to Lakeland, Florida. It arrived on October 20th and is ready for installation. Special thanks to Sears; they really helped out with a difficult problem.
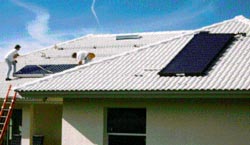
PVRES Gets a Cool Roof
Over the last five years, FSEC has conducted numerous experiments examining how altering residences to white roofs can reduce cooling energy needs. The average cooling energy reduction based on tests in a dozen homes converted to white roofs has averaged 19%. Based on testing performed at the FSEC’s Flexible Roof Facility last summer, we learned that of the evaluated roofing systems (radiant barriers, added ventilation, white tile and white metal roofs), white tile provides the best cooling related performance of any of the options. Relative to a black asphalt shingle roof, our white tile roof saw a 76% reduction in overall summer ceiling heat flux (all test cells have R-19 ceiling insulation present).

Moreover, when the outside summer air temperatures were at their peak, the coincident peak attic air temperature difference was 40°F lower in the white tile test cell (91.4°F) than the construction with black asphalt shingles (131.5°F). The measured attic air temperature is actually lower in the attic than the ambient air temperature until 2 PM in the afternoon on a typical summer day!
The developing case for the superiority of white tile roofs in Florida’s climate is another illustration of the wisdom of considering traditional architecture. It seems that after World War II, prior to air conditioning, white tile roofs were nearly universal in new construction in South Florida because of their perceived advantage in fighting the heat. In a 1950 article appearing in House Beautiful entitled “Your House in Florida”, architect Wolfgang Langewiesche says it all:
“Your roof must be white. The white color throws much of the heat back into the sky before it ever gets into the roof. This is one climate control idea that is universally accepted in Florida now…Insulation is a must, but without the white color, would finally get hot.”

Both our test homes have R-30 insulation blown in the attic, but two major differences for the PVRES home. The improved house features a white Mission concrete “S” tile roof — donated to the project by the Monier Company — to take advantage of its superior thermal performance. The control home’s roof is conventional: popular gray-brown asphalt shingles. We had both roof materials evaluated by DSET Laboratories. The solar reflectance of the Monier white S-tile tested at 77% while the reflectance of the gray-brown architectural asphalt shingle was only 7%. The tile roof was installed on the PVRES home in January of 1998.
Secondly, the duct system in the PVRES home is located within the conditioned space — perhaps the biggest design challenge of the entire project. In the control home the ducts are located in the attic, the current practice in almost all Florida homes being constructed.
Solar Thermal: Solar Water Heating System

The PVRES home substitutes propane for what are normally electric resistance end-uses in conventional homes. This is done to better allow the PV system to match the home’s load. For instance, a simple resistance element in a hot water tank (4.5 kW) demands more electrical input than the entire PV system will be able to provide. Propane was used for the oven/range, the clothes dryer, back-up heating for hot water and a direct-vented fireplace.
The Control home contains a standard electric resistance 52 gallon storage tank (Rheem 81V5D) in the garage, rated to use 4,828 kWh/year (actual consumption in Florida should be much lower because of our higher inlet water temperature). However, propane is a fairly expensive fuel (approximately $1.40/gallon or $15/MMBtu in Florida), so we endeavored to reduce propane use by the PVRES home. An important measure was to use a solar water heating system with propane back up. Our objective was to provide 70% solar fraction with the solar water heating system at the PVRES home so that propane use is confined mainly to clothes drying and cooking.
The hybrid solar water heating system was installed in the PVRES home in February by Solar Source, a Clearwater, Florida firm. The system consists of a forty square foot American Energy Technology AE-40 solar collector (shown in Figure 15) mounted on the south side of the home’s roof. The collector is rated at an energy production of 45,600 Btu/day at the low temperature (95oF) rating. Parasitic pump power is avoided through the use of a 10W PV panel with an Ivan Labs SID-10 magnetic impeller pump. The collector feeds the solar primary tank, a Lochinvar FTA-082-K with an 80 gallon storage capacity. The storage system is made up of two tanks, a primary solar tank and an A.O. Smith FPSE 40 gallon back-up propane tank. The propane tank is a high efficiency direct vent model with electronic ignition. The back-up propane tank is elevated so that it thermosiphons from the primary solar tank only if the water in the solar tank is warmer than the back-up; otherwise it provides feed water to the back-up tank when hot water is drawn.
We collect data on hot water use (gallons each 15-minutes) as well as electricity use in the control home and propane consumption in the PVRES household. Over the occupied monitoring period, daily hot water use averaged 37.8 gallons per day against a daily propane consumption of only 3.2 ft3 – about 0.09 gallons per day. The installed water heater has a rated energy factor of 0.65 with the measured tap hot water temperature 130oF. Based on measured hot water use and a temperature rise from 80oF to 130oF estimates that propane consumption should be approximately 0.264 gallons/day without the solar assist. This implies a solar water heating fraction of approximately 66%.
Innovative Wall Insulation System

In conventional residential construction in Florida, walls are insulated with R-3 to R-5 insulation on the interior of masonry walls. This is precisely what is being installed in our standard home, a layer of foil (ALFOL Reflective Insulation) suspended between interior furring strips claimed to provide an equivalent insulation value of R-4.2. Contrary to this practice, however, the concrete block walls of the PVRES home have been insulated on the exterior. The Celotex Corporation has assisted the project by providing 1 1/4″ Tuff-R Cisocyanurate insulation. Dick Edwards has worked with the job foreman, Gary Morrison, to resolve issues associated with the unusual application. An exterior application is being used to encapsulate the building in R-10 insulation so that the masonry portion of the building can be pre-cooled during the daytime hours when solar availability is high and the PV system output is at its maximum. The thermal capacitance of the building will then help to reduce air conditioning needs during the late afternoon and early evening hours.
Innovative Solar Water Heating System
True to our original concept, the PVRES home substitutes propane for what are normally electric resistance end-uses in conventional homes. Propane will be used for the oven/range, the clothes dryer, back-up heating for hot water and a direct-vented fireplace. This is done to better allow the PV system to match the home’s load. The logic is apparent when you consider that a simple resistance element in a hot water tank (4.5 kW) demands more electrical input than our entire PV system will be able to provide. The Control home contains a standard electric resistance 52 gallon storage tank (Rheem 81V5D) in the garage rated to use 4828 kWh/year (actual consumption in Florida should be much lower because of our higher inlet water temperature). However, propane is a fairly expensive fuel (approximately $1.40/gallon or $15/MBtu in Florida), so we wanted to take measures to reduce propane use by the PVRES home. One of the most important of these is the decision to use a solar water heating system with propane back up.
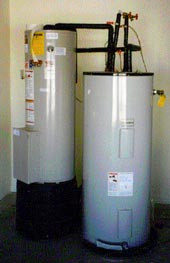
The hybrid solar water heating system was installed in the PVRES home in February by Solar Source, a Clearwater, Florida firm. The system consists of a forty square foot American Energy Technology AE-40 solar collector mounted on the south side of the home’s roof. The collector is rated at an energy production of 45,600 Btu/day at the low temperature (95oF) rating. Parasitic pump power is avoided through the use of a 10W PV panel with SID10 (Ivan Labs) magnetic impeller pump. Collector freeze protection is provided by a Eaton FP-35 freeze protection valve. The collector feeds the solar primary tank, a Lochinvar FTA-082-K with an 80 gallon storage capacity. The storage system is made up of two tanks, a primary solar tank and an A.O. Smith FPSE 40 gallon back-up propane tank. The propane tank is a high efficiency direct vent model with electronic ignition. It is elevated so that it thermosiphons from the primary solar tank only if the water in the solar tank is warmer than the back-up; otherwise it provides feed water to the back-up tank when hot water is drawn.
Our objective is to provide at least a 70% solar fraction with the solar water heating system at the PVRES home so that consumption propane is confined mainly to clothes drying and cooking. We will be collecting data on hot water use (gallons each 15-minutes) as well as electricity use in the control home and propane consumption in the PVRES household. We should know more from the data about this time next year.
Better Windows for Efficient Florida Homes
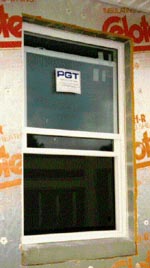
Windows are almost always known to be the largest source of cooling loads in Florida residential buildings. Most know that a low Solar Heat Gain Coefficient (SHGC) is a must to keep out the sun’s heat, and a low conductance or U-value (Btu/hr-sqft- F) is important to reduce design cooling load. The most common windows used in Florida homes hardly meet these needs. Typically, windows are single pane clear glass with aluminum frames (SHGC= 0.875, U= 1.1).
For the PVRES home, we desired to locate the very best performing product available for the residential market. However, simply a low SHGC could not be the sole objective; very low solar heat gain values can indicate windows with a dark tint that transmit very little visible light. This can reduce daylight to such a point that occupants have to use electric lighting to supplement — certainly not reducing energy use. And physical appearance is also important; this generally excludes either dark tints or reflective products which give the outside of the building a mirrored look. We desired a spectrally-selective product. This means a glazing which transmits much of light in the visible portion of the solar spectrum, but limits transmission in the infrared and ultraviolet portions which cause overheating and fading of interior materials.
We selected PPG Industries’ Sungate 1000 solar control, low-E glass product with Argon gas fill. As shown in the table below, Sungate 1000 has a SHGC of only 0.38 and center-of-glass U-value of 0.24. We reduced heat transmission through the window frame by specifying white thermally broken vinyl frames (overall U-value= 0.35). What does this mean for the required size for the air conditioning system? Plenty. With 384 square feet of glass in our floor plan, calculation with Manual J showed a 7,700 Btu/hr difference (0.64 tons) in the required size of the air conditioning system — a large reason why we are able to use an air conditioner half the size of that in the standard building. And the Sungate windows are spectrally selective, providing a daylight transmittance of 73% against 90% for single glazing as well as a color neutral appearance.
| Air Space (inches) |
Glass Thickness (mm) |
Unit Construction | Daylight(%) | Shading Coeff- icient |
Solar Heat Gain Coefficient | U-Value Center-of-Glass |
R-Value Center-of-Glass |
Indoor Glass Temperature Winter-oF | |||
| Trans- mittance |
Reflec- tance |
Winter | Summer | Winter | Summer | ||||||
| – | 3.0 | Clear, monolithic | 90 | 9 | 1.00 | 0.85 | 1.11 | 1.03 | 0.90 | 0.97 | 16 |
| 1/2 | 3.0 | Clear & Clear | 81 | 16 | 0.87 | 0.75 | 0.49 | 0.55 | 2.04 | 1.82 | 45 |
| 1/2 | 3.0 | Sungate 1000(2) & Clear | 73 | 12 | 0.45 | 0.39 | 0.30 | 0.30 | 3.33 | 3.33 | 54 |
| 1/2 | 3.0 | Sungate 1000(2) & Clear with Argon gas fill | 73 | 12 | 0.44 | 0.38 | 0.24 | 0.23 | 4.17 | 4.35 | 57 |