Flash Testing with Sinton FMT-350 Solar Simulator
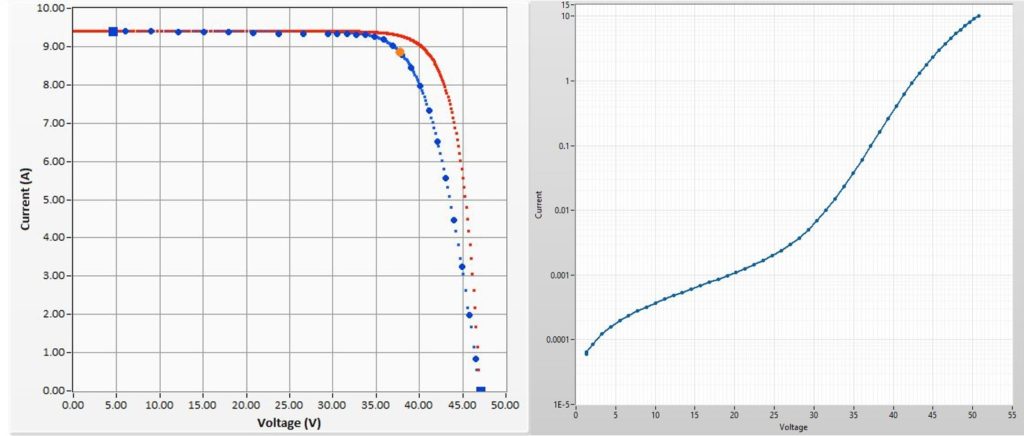
A module’s performance characteristics change over time as it is exposed to the elements. Illuminated and dark current-voltage (I-V) measurements describe these characteristics and are used to pinpoint how the module’s performance changes. Analyzing this data provides insight into the underlying mechanisms behind this change, or degradation.
Illuminated I-V is the standard technique for characterizing a module’s performance. The most notable parameters extracted from I-V are fill factor (FF), short-circuit current (Isc), open-circuit voltage (Voc), maximum power (Pmp), and current and voltage at the maximum power point (Imp and Vmp, respectively). Knowing which parameter changes gives an idea as to what type of degradation is occurring (optical, resistive, or recombination).
Suns-Voc is a technique that measures intensity versus Voc and is often used to build a pseudo-I-V curve. This curve essentially describes what a module’s performance would be if it had no series resistance. Coupling I-V and pseudo-I-V gives a more accurate series resistance value, and also provides carrier density and lifetime information.
Dark I-V data can be used to describe the recombination and junction characteristics of the module. It could also be used to obtain a series resistance value. Outside of the context of degradation studies, its usefulness is debatable. Series resistance values obtained for dark I-V curves measured over time could give information about a module’s resistive degradation mechanisms.
Years of Research: 1980-Current
Sponsored by: U.S. Department of Energy, Sandia National Laboratory, National Renewable Energy Laboratory
Suggested Publications
- Silicon Heterojunction System Fields Performance
- Analysis of measured photovoltaic module performance for Florida, Oregon, and Colorado locations
- Comparative study of the performance of field-aged photovoltaic modules located in a hot and humid environment
- Multi‐pronged analysis of degradation rates of photovoltaic modules and arrays deployed in Florida
- Study of Delamination in Acceleration Tested PV Modules
Electroluminescence Imaging
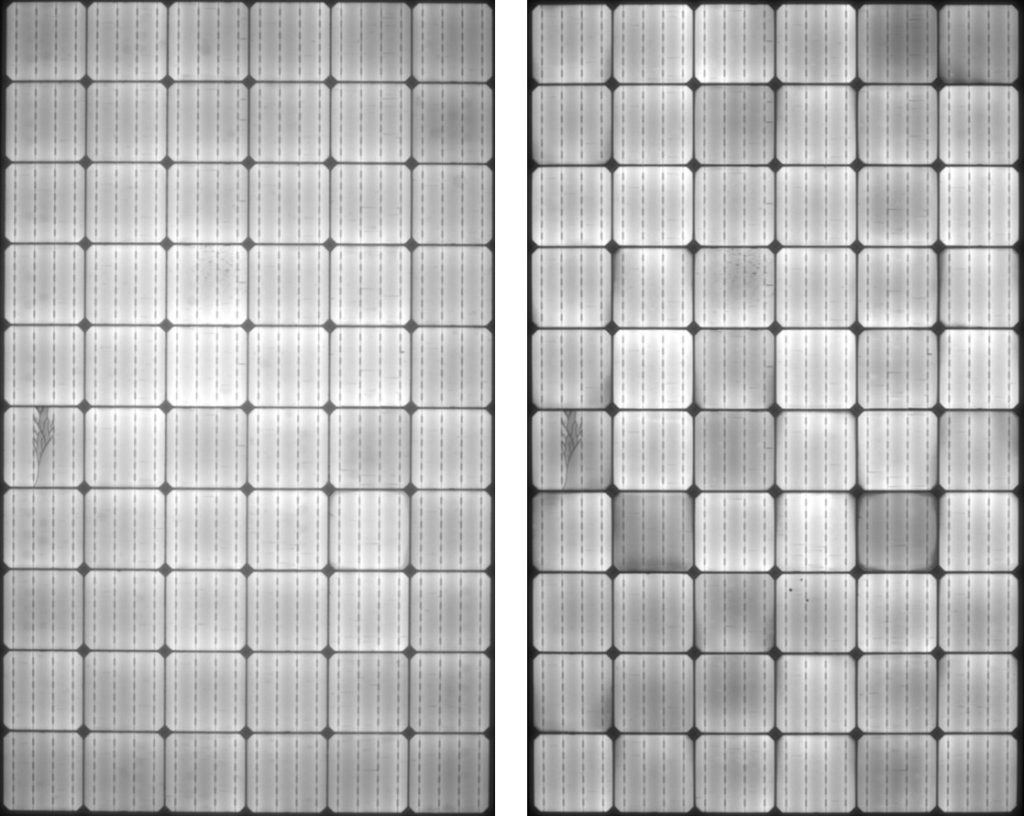 Electroluminescence (EL) imaging allows us to see features within modules that are invisible to the naked eye. Using EL imaging alongside I-V measurements provides powerful insight into how a module degrades. For example, interconnection failures reduce power and increase series resistance. While those parameters can be tracked using I-V, it is unsure what the cause of those changes is unless EL images are available. These changes are not only detectable by visual inspection, but by quantitative analysis.
The value of EL images used to be restricted to visual, qualitative analysis. In recent years, much work has been done to show the value of quantitative EL image analysis, including work done at UCF’s Orlando, Fla. campus and FSEC. There are subtle changes in the module’s performance that are not visible to the naked eye when viewing a module or its EL image. By peering into the actual pixel intensities of the images, their changes over time reveal information that is not obvious. For example, cells could darken so subtly that the images look the same but the analysis reveals a performance change.
Suggested Publications
- Extracting Cell Level Characteristics from Photovoltaic Module Electroluminescence Images
- Silicon Heterojunction System Fields Performance
- Quantitative analysis of crystalline silicon wafer PV modules by electroluminescence imaging
Mechanical Durability Testing
Load testing seek to replicate real-world stress factors from shipping, install, snow, wind, temperature, hail, and others. Load testing is required for module certification according to IEC 61215 and IEC 62782 standards. New materials and designs can influence the behavior and stress/strain characteristics of the module under load: Many degradation modes are revealed by load testing cell cracking (hot spots), interconnect wire fatigue, solar bond integrity, edge seal integrity, and adhesion of layers at various interfaces.
We use the LoadSpot load tester from BrightSpot. It offers the advantage of an unobstructed front side, which allows for in-situ characterization under load using EL imaging and flash testing. The LoadSpot tester is capable of achieving uniform pressures beyond ± 5400Pa and cyclic loading up to 1Hz. Using the LoadSpot tester, we are also able to evaluate various mounting configurations as in the case of trackers.
3D surface mapping to measure displacement under load is achieved by inserting an array of IR sensors in the backplane of the LoadSpot tester in the upper left quadrant of the module. A full surface map is subsequently generating using computer software and making use of the 4-fold symmetry that exists when performing uniform load testing.
Thermal Cycle Test (½ TC)
½ Thermal Cycling test allows for low cost thermomechanical loading of the module based on thermal cycle specifications as described in the IEC61215 standard. Only half cycle (cold part of the cycle) is perform during which the temperature is reduced from 25°C to -40°C and then raised back to 25°C. This test reveals a module’s susceptibility to cracking in cold climate.
Thermography Imaging
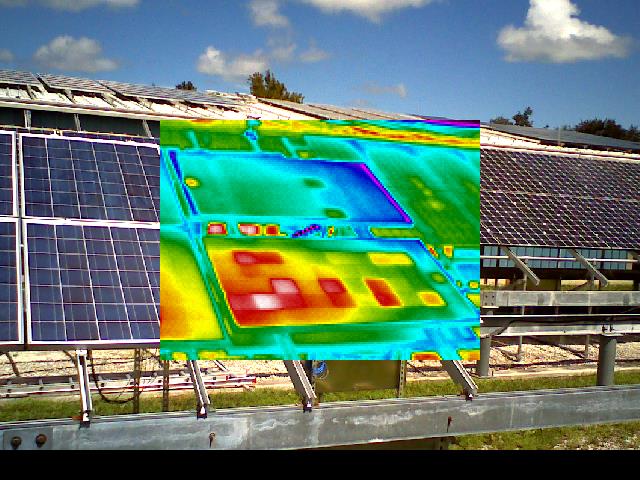
Thermography imaging allows us to visualize the temperature profiles of modules. Different module technologies and assemblies (packaging schemes) exhibit different profiles. Studying how these profiles relate to performance and reliability gives information that helps improve the state of the art.
Thermography imaging quickly pinpoints troubled regions within modules. It is often used to inspect fields to detect under-performing modules. As modules degrade in different ways, spatial temperature profiles may change. Degradation mechanisms that contribute to this include delamination and hot spots.
Delamination reduces the encapsulant’s ability to transfer thermal energy away from cells. Cells can overheat and not only suffer in performance but also can present a safety risk if hots pots form. Hot spots are local shunts through which elevated levels of current transfer. These regions are at an especially high temperature and are easily visible with a thermography camera. If left unchecked, a hot spot could melt polymeric components (encapsulant and backsheet) and eventually start a fire.
Forensic Failure Analysis
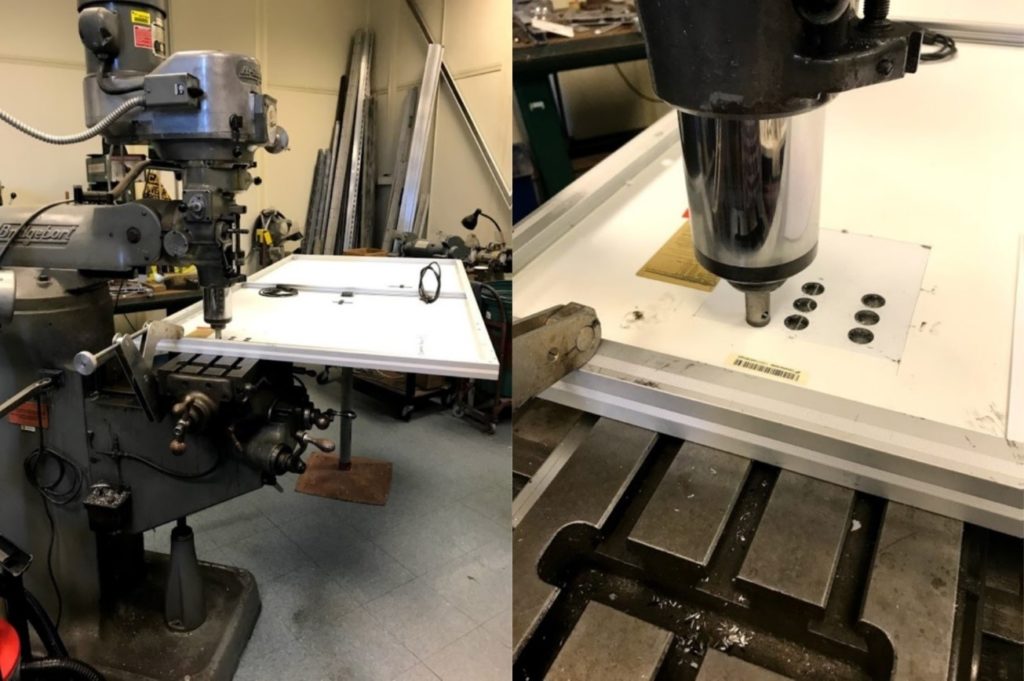
Various characterization techniques reveal how a module is degrading, but even these give limited insight into underlying mechanisms. For deeper material characterization, a researcher can look at images of the module (visual, electroluminescence, photoluminescence) and determine regions of interest that are representative what is seen across the module or of particular mechanisms. Samples can be cored from these regions and examined using Scanning Electron Microscopy (SEM), Energy-Dispersive X-ray spectroscopy (EDX), and X-ray Photoelectron Spectroscopy (XPS).
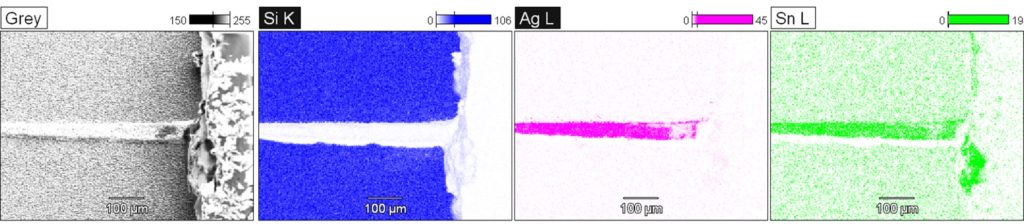
SEM images are used to give topographical and chemical information about the sample. Voids, disconnected contacts, crystallite formation, etc., are visible using SEM. EDX gives maps of chemical composition that can be used to show oxide formation and element migration. XPS provides more detail on the chemical composition by plotting present oxidation states of the components. This can point to potential chemical reactions that could have occurred.
Degradation mechanisms are affected by what materials are used in modules and the processes used to manufacture them. As PV continues to evolve, emerging technologies need to be tested to verify reliability. This involves a comprehensive suite of characterization techniques to probe into the degradation mechanisms at the material level. Manufacturers can use this information to more effectively design PV modules for better performance and reliability.